Cloud Infrastructure
Introduction
This tutorial gives the user hands-on experience with Bayware’s SDK, Orchestrator, Processors, and Agents. By following the steps outlined below, you will create a Bayware network that spans three public cloud providers, manually deploy a microservice-based application called Getaway App, use Ansible to deploy a second microservice-based application called Voting App, and finally use Bayware’s Network Microservices to experience the simplicity in managing your network in a hybrid cloud environment.
To use this tutorial, you should have already received an email from Bayware with an attached personal Sandbox Installation Summary (SIS) page. If you have not received this email or have not yet contacted Bayware regarding your interest in running this tutorial, please reach out to us from our contacts page. Alternatively, you may follow along by referring to an example SIS.
This tutorial assumes you have internet access, a web browser, and a terminal window all running on the same computer. Your computer should have an ssh client installed and you should be familiar with using and executing commands using a command-line interface. This tutorial runs equally well in Linux, MacOS, and Windows.
Tutorial Outline
This tutorial is broken up into the following steps.
Setup Enterprise Cloud Infrastructure
Deploy Service Interconnection Fabric for Applications
Deploy Application 1 - Getaway App
- Manually Install Application Microservices with Bayware Interface
- Demonstrate Microservice Mobility
- Demonstrate Policy Enforcement with Network Microservices
- Delete Application & Clean VMs
Deploy Application 2 - Voting App
- Use Ansible to Install Application Microservices with Bayware Interface
- Demonstrate Microservice Mobility
- Demonstrate Policy Enforcement with Network Microservices
- Delete Application & Clean VMs
Enterprise Cloud Infrastructure
Compute Resources
You have been tasked with deploying two microservice-based applications in a multi-cloud environment. The cost and service-level differences among public cloud providers are substantial enough that you need to ensure easy mobility of your microservices from one public cloud to another and, moreover, guarantee that your customers are using your resources in an efficient, cost-effective manner. Security requirements and other policy enforcement considerations are tantamount to a successful deployment.
Imagine that you have setup your enterprise cloud infrastructure using 17
virtual machines (VMs) spread across Amazon Web Services (AWS), Google Cloud
Platform (GCP), and Microsoft’s Azure. For security concerns, you will manage
your network from a single node. This node, VM1 or aws-bastion (see your
SIS page), is called the Customer Command Center (CCC).
All interaction with VM2 through VM17 takes place from your CCC. As such, you
have ssh password access to your CCC and ssh key access
to all other VMs from your CCC.
Since you’ll be referring to it frequently, keep a copy of the SIS available that you received in the Welcome to the Bayware Tutorial email. (Alternatively, you may refer to the example SIS that is in this tutorial. In that case, you will have no VM resources, but you will be able to read through the tutorial in context.)
On your SIS page, note that this tutorial may refer to the
VMs in the table using either the VM number indicated in column one or the host
name indicated in column two. For example, in the next section you will be
asked to log into the Bayware processor in GCP. The tutorial will refer to this
VM as either VM12 (its VM number) or gcp-p1-382fd7 (its host name). Since
the suffix of each host name is user- (or sandbox, sb-) specific, the tutorial
would, for instance, abbreviate the host name associated with VM12 as
gcp-p1.
From your CCC, you may log into other VMs using their public IP addresses or
their truncated host name. When the tutorial uses a public IP address, it will
be referred to as VM<num>-IP. So the IP address for VM12 is written as VM12-IP,
which can easily be referenced from the table in the SIS.
The /etc/hosts file on the CCC, however, has been pre-configured to map
truncated host names with their IP addresses. So you can login to
gcp-12-382fd7, for instace, using ssh@gcp-12 from the CCC.
Web pages used throughout the tutorial use FQDNs and are listed near the top of your SIS.
Command Center
So let’s get started with some typing by logging into your CCC from your local
computer using the username (centos) and the password listed in the table on
your SIS for aws-bastion. For your convenience, you
can use the bastion’s FQDN, which should look something like
ap382fd7.sb.bayware.io. You can find the full bastion FQDN on your
SIS just above table row 1 of the VM table (look for
bastion FQDN). Just be sure to replace the 382fd7 with your own
sandbox name. Enter the following command and hit return:
]$ ssh centos@ap382fd7.sb.bayware.io
Be aware that the first time you log in to a new machine, you might see a scary warning message that looks like
]$ ssh centos@ap382fd7.sb.bayware.io
The authenticity of host 'ap382fd7.sb.bayware.io (13.56.241.123)' can't be established.
ECDSA key fingerprint is SHA256:6LLVP+3QvrIb8FjRGNleLQRy7zL2eXeNCdOoYRbbxqw.
ECDSA key fingerprint is MD5:7b:fd:15:4c:35:d3:1d:20:fd:3e:3d:b7:1b:14:6a:1b.
Where it asks if you wish to contine, just type yes.
Are you sure you want to continue connecting (yes/no)? yes
You will be prompted for your password with the following query
centos@ap382fd7.sb.bayware.io password:
Type in the password for your aws-bastion. Again, this is located in the
rightmost column of row one on the VM table in your SIS.
If all goes well, you should now see a prompt in your terminal window such as
[centos@aws-bastion-382fd7 ~]$
That’s all for now on your CCC. But don’t close the terminal window since you’ll use it the next section when you install the service interconnection fabric. And, if it’s not completely clear, you can always open up more terminal windows on your local computer and log into your CCC from them so you have more windows to work with.
Good Housekeeping
The 17 VMs running across the three public cloud providers started with stock CentOS 7 images. You can ping your VMs, but not much else, since cloud provider security groups have been set to allow SSH, ICMP, and a couple of UDP ports you’ll need for IPsec.
To ensure the operating systems on all VMs are starting from the same point, we’ve already done a few upgrades for you including the following
- updated all CentOS 7 packages
- added repository
epel-releaseandbayware-repo- installed, started, and enabled firewalld
- set firewall rules on public zone, which includes eth0, to allow IPsec and accept GRE tunnels
- and installed orchestrator and telemetry tools: telegraf, InfluxDB, Grafana
Now all your VMs are locked down with only the minimally required access allowed.
Orchestrator
Finally, you will be performing many tasks in this tutorial using the Bayware
Orchestrator. As such, open a new tab in your browser and navigate to the
web address for the orchestrator listed in the table near
the top of your SIS. The address should look something
like https://c1382fd7.sb.bayware.io. The login page should appear as
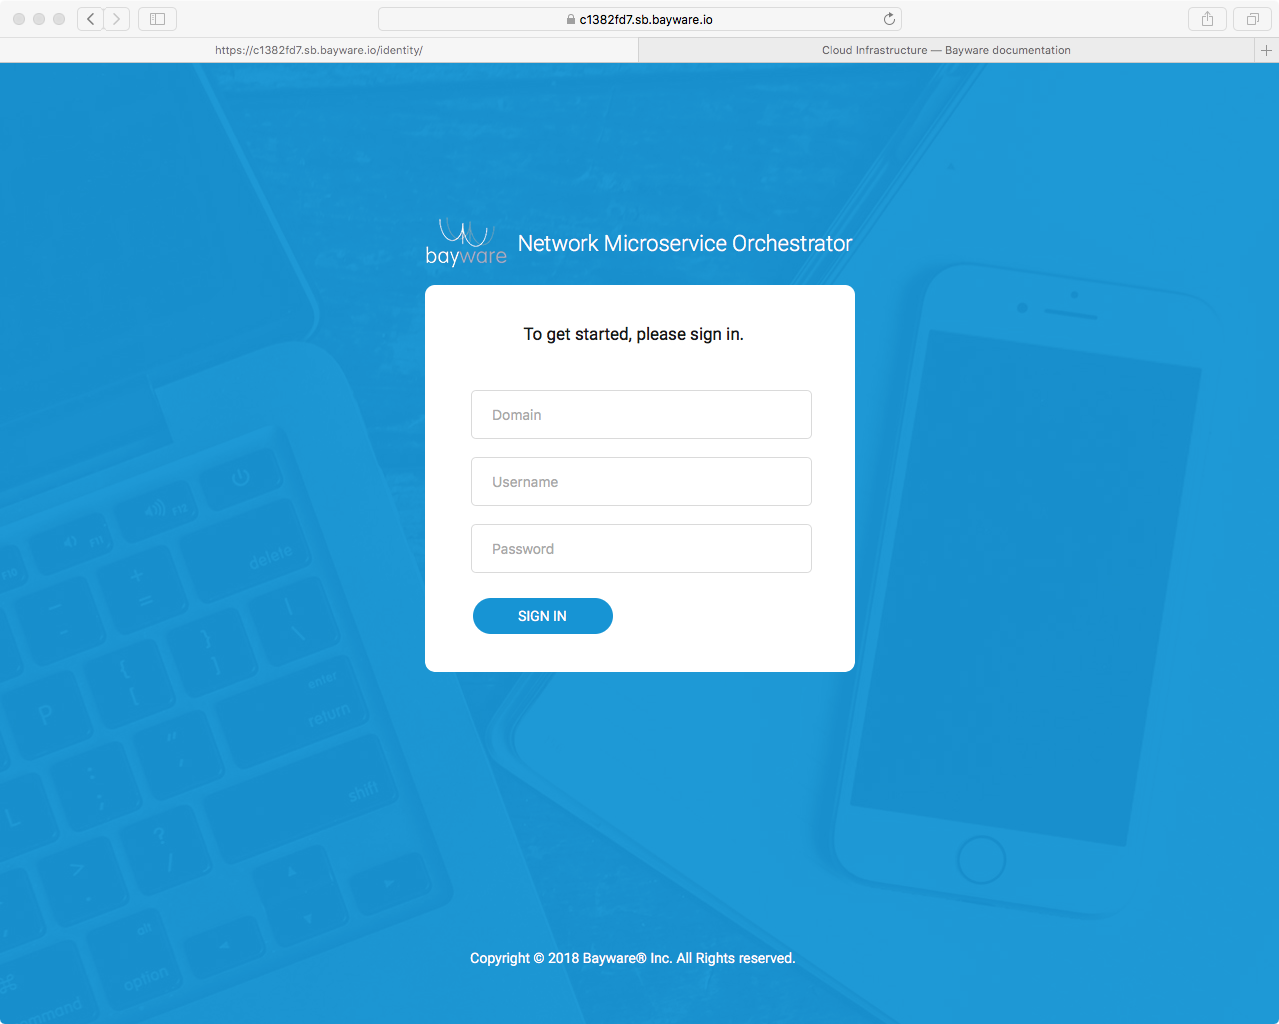
Fig. 16 Orchestrator Admin Login Page
Use the orchestrator credentials shown in your
SIS to sign in. You’ll find this on row 18 in the tables
in your SIS. (Note that your orchestrator login
credentials are different from the username and password for aws-c1 shown
in the table in your SIS. The former logs you into the orchestrator application
running in your browser while the latter, if allowed, would simply log you into
the Linux operating system running on aws-c1.)
After successfully logging into your orchestrator, you should see a page such as
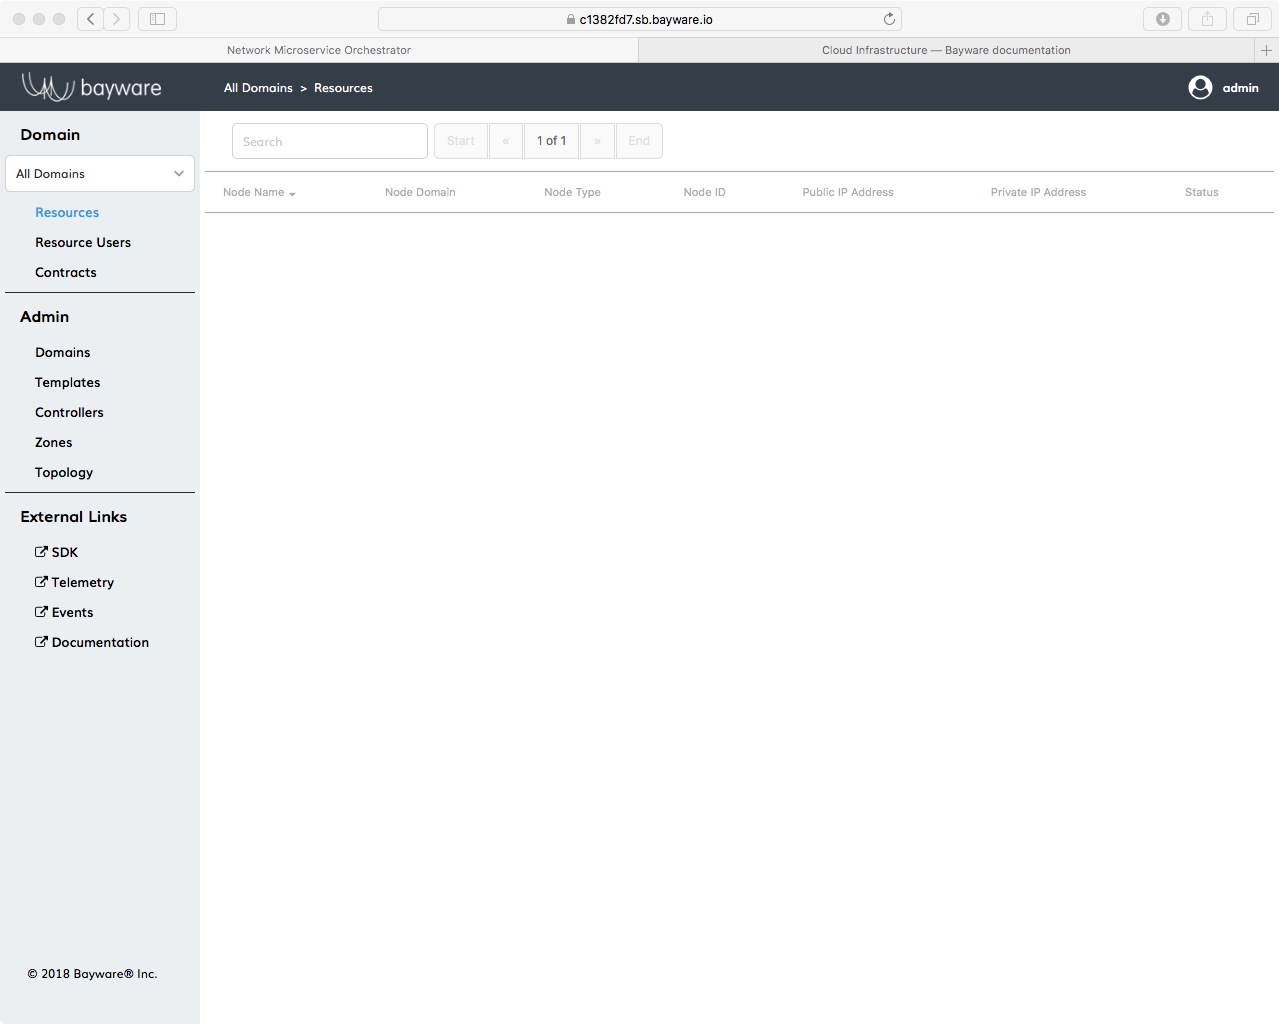
Fig. 17 Clean Orchestrator After Login
Now you’re all set up for the steps that follow.
Visibility
If you’re commanding a giant infrastructure of 17 virtual machines using Bayware technology, it’s good to be able to have a look at what they’re doing. For that, Bayware has teamed with Grafana to display all types of telemetry information–from the usual processor load and memory usage to Bayware-specific dashboards such as GRE interface usage and IPsec traffic. You can conveniently get to telemetry information by clicking the Telemetry link in the left-side navigation bar on the orchestrator as shown in Fig. 18.
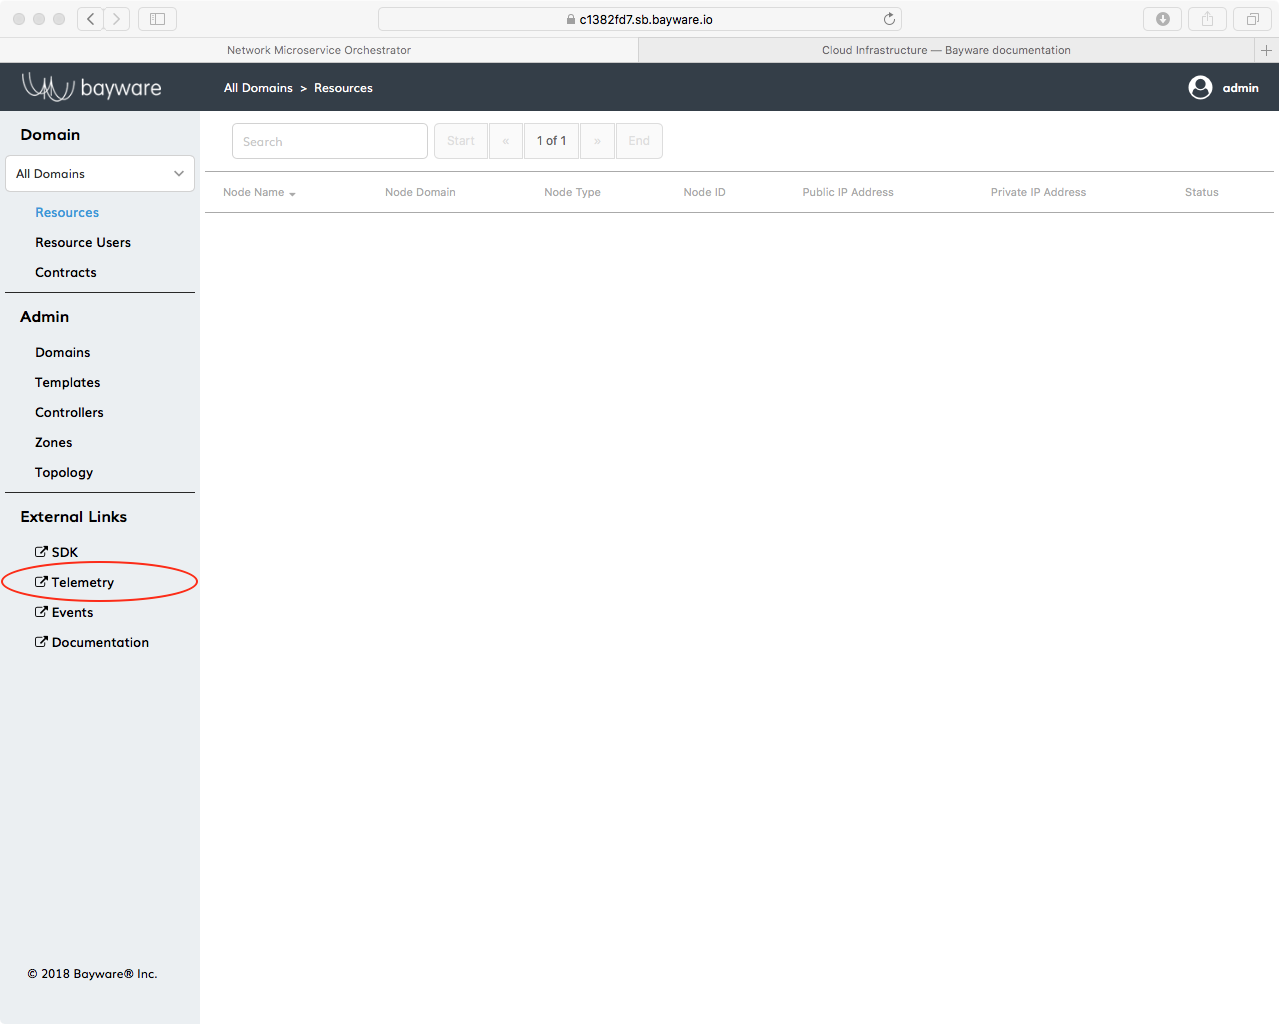
Fig. 18 Access Telemetry from the Orchestrator
You can scroll through the dashboard to see telemetry information for the server indicated at the top of the window.
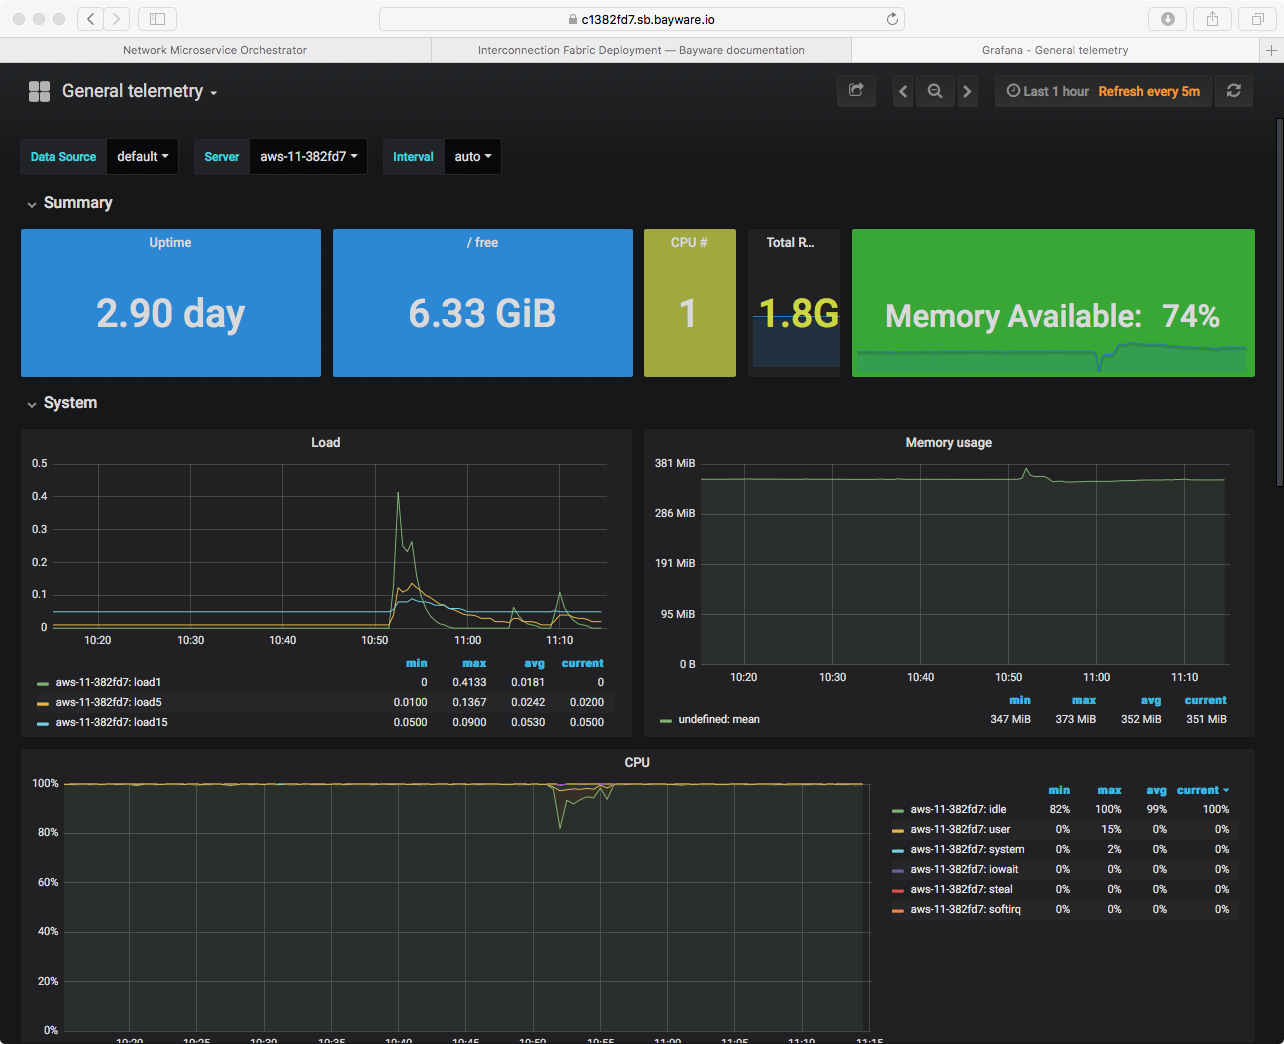
Fig. 19 Telemetry Using Grafana
Or use the drop down menu as shown in Fig. 20 to check out stats for a different virtual machine.
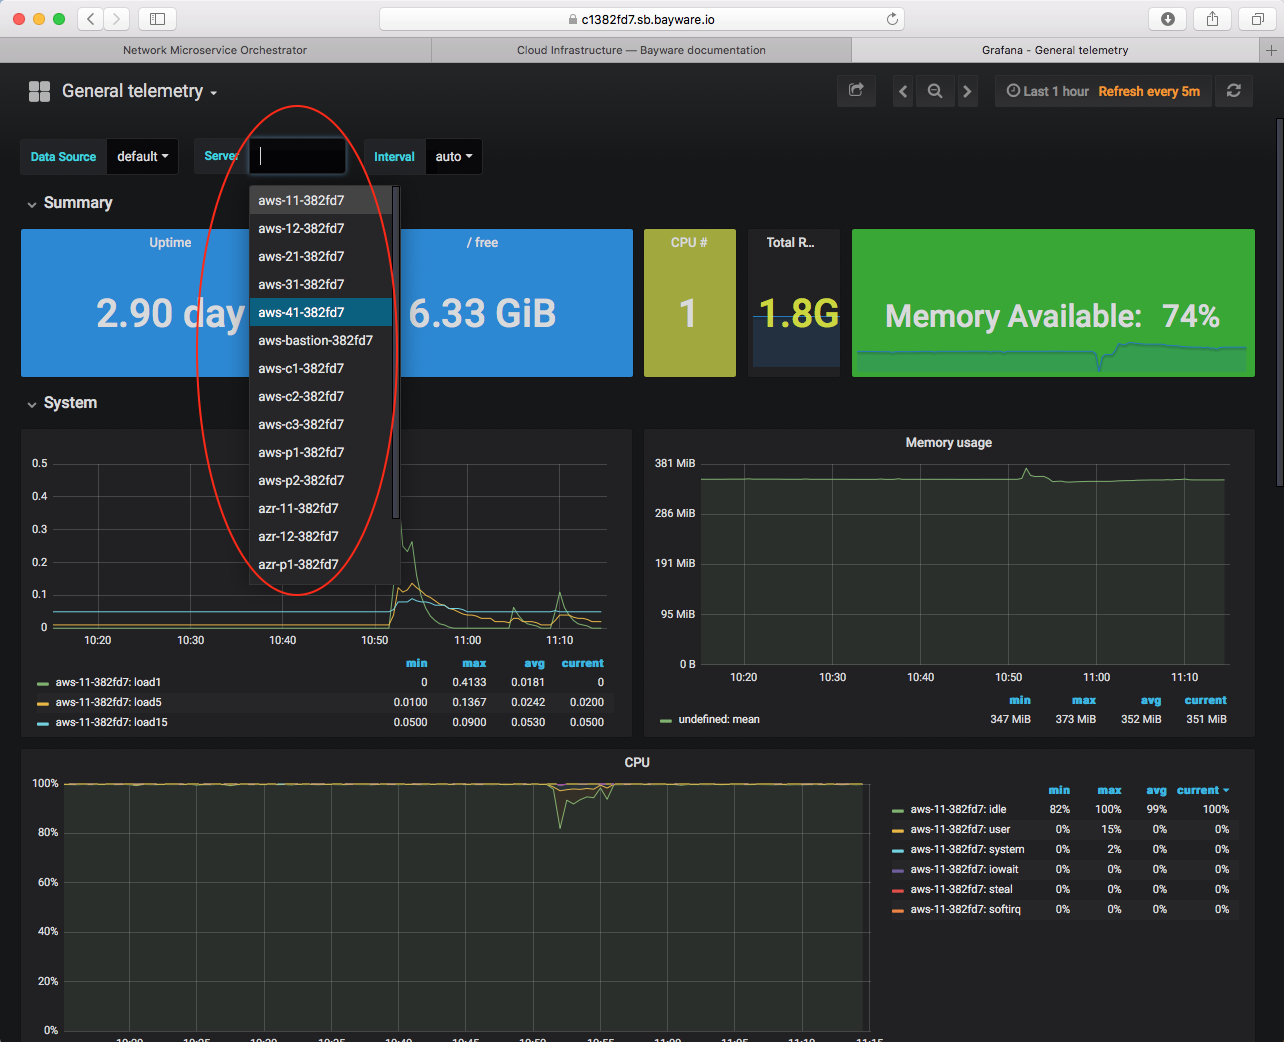
Fig. 20 View Telemetry for a VM
Summary
Good job! Now you have an idea where you’re headed in the next sections and you’ve practiced logging into your control center from which you’ll manage all your infrastructure resources. You should be comfortable navigating to your orchestrator browser page and know that you can get telemetry information about any of your virtual machines through the Grafana application. And, importantly, you have reviewed some of the information on your Sandbox Information Sheet (SIS) and you know not to confuse the example SIS located in this documentation with the personalized version you received from Bayware, which you’ll use extensively throughout the remainder of this tutorial.
Next up: create a Bayware service interconnection fabric…