Telemetry
This section provides an overview of some of the telemetry features available using the policy orchestrator. A small description accompanies each of the following figures. After reading through this section, you are encouraged to view the telemetry application in your own sandbox.
From the orchestrator GUI open in your browser, click on Telemetry in the sidebar navigation menu. A new window will open in your browser similar to Fig. 95.
You can see from the figure that there are four VPCs running in this sandbox:
- AWS1: the orchestrator nodes operate in an AWS VPC in Northern California
- AWS2: a processor node and two workload nodes operate in a VPC in Northern Virginia
- GCP1: a processor node and three workload nodes operate in a VPC in Northern Virginia
- AZR1: a processor node and three workload nodes operate in a VPC in Texas
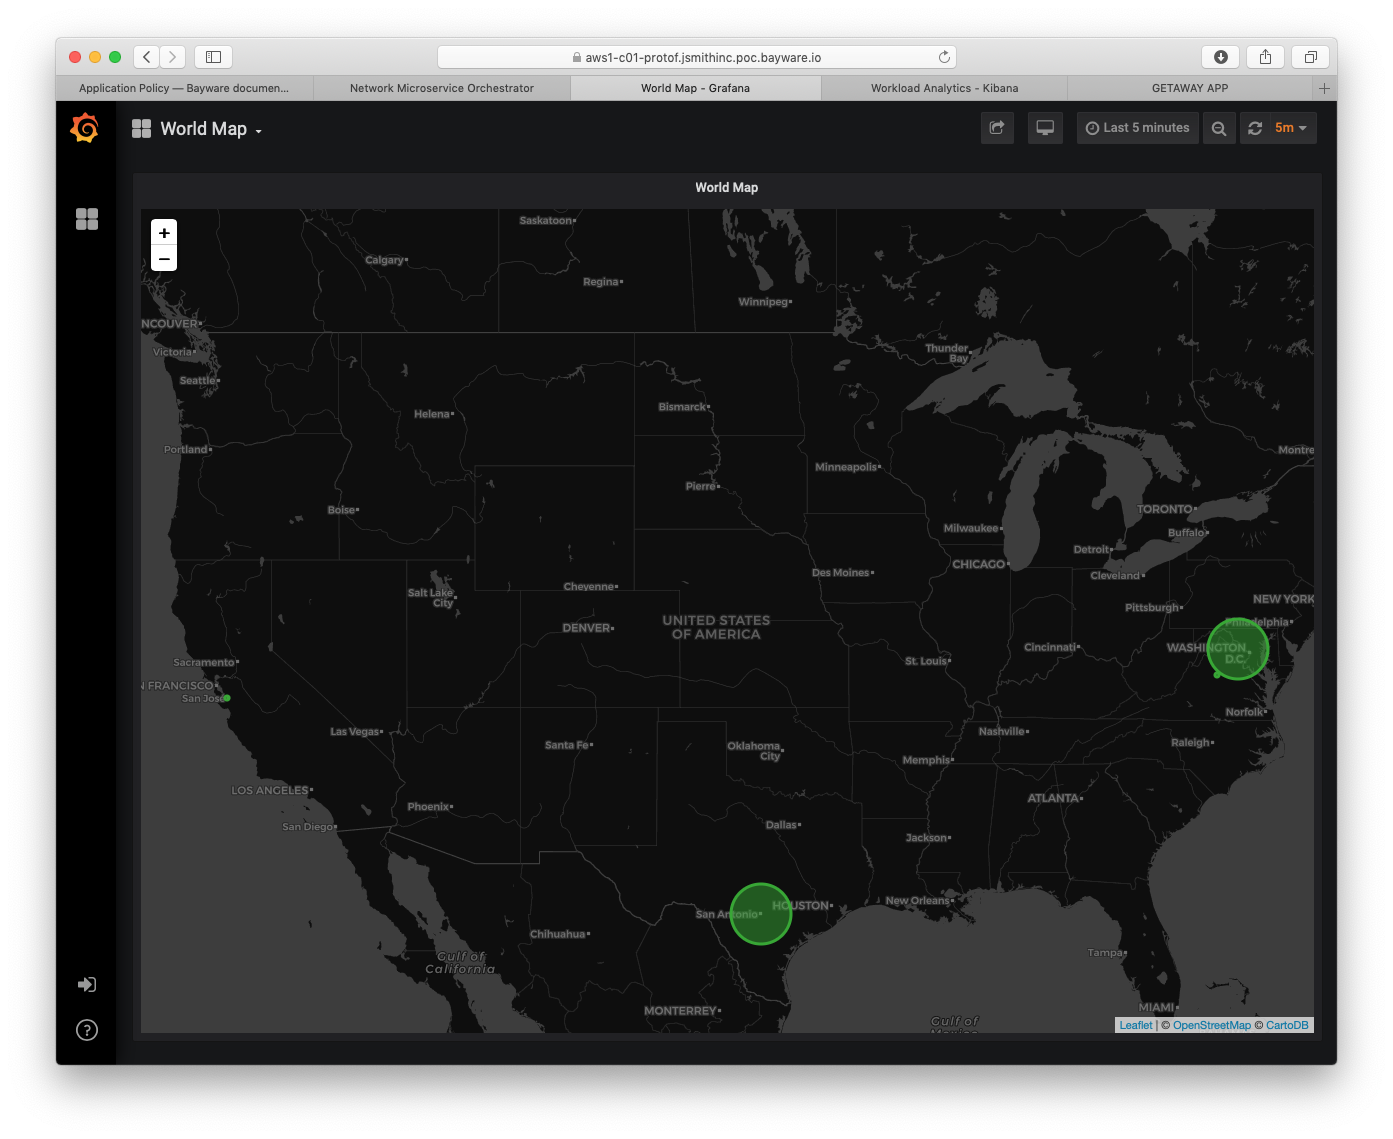
Fig. 95 VPC Locations
To navigate between dashboards on the telemetry page, click on World Map in the top-left corner. A list of available dashboards appears. Clicking on Orchestrator Telemetry brings up a window similar to the one in Fig. 96.
You may also find the following telemetry features useful when viewing your dashboards:
- Server - view statistics for a given server by clicking on this drop-down menu near the top
- Last 1 hour - change the displayed time interval
- panels - most panels are initially collapsed and can be expanded by clicking on the panel title
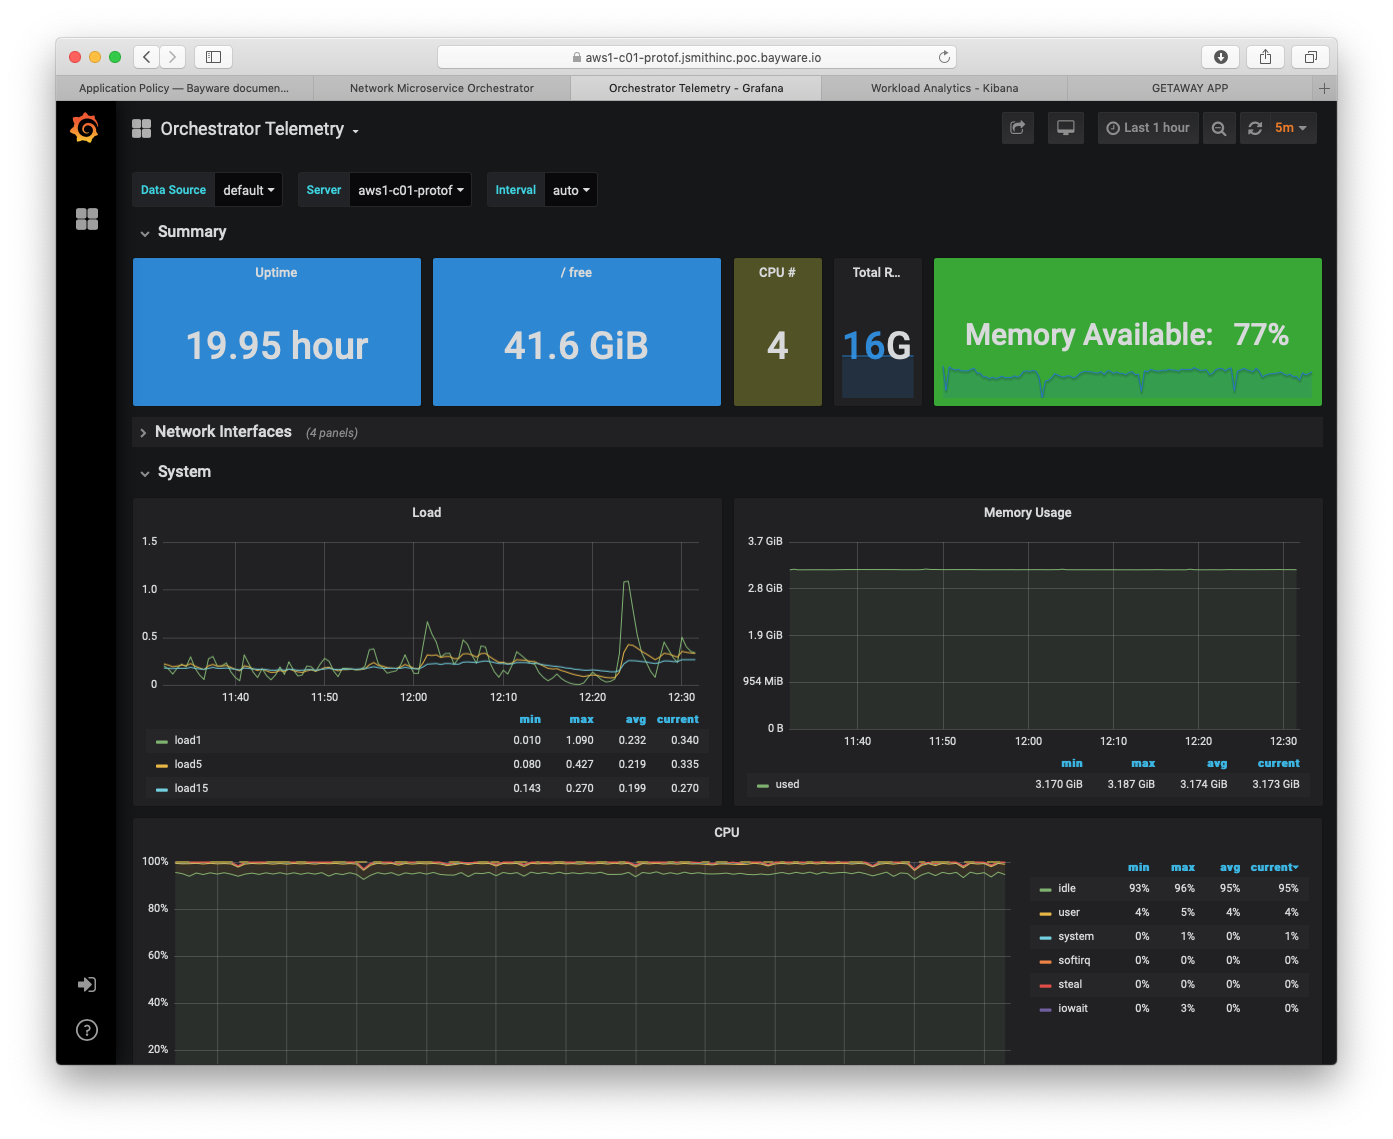
Fig. 96 Orchestrator Telemetry
Fig. 96 show Orchestrator Telemetry for server
aws1-c01-protof. This server, c01, runs the policy controller
software. There are two additional servers in the orchestrator. c02 runs
the Telegraf, InfluxDB, and Grafana stack for telemetry (what you are currently
viewing); and c03 runs the Elasticsearch, Logstash, Kibana (ELK) stack for
logging. Both are available as open source.
Now switch to the Processor Telemetry dashboard. Do this by clicking on the down arrow next to Orchestrator Telemetry located in the upper left corner of the window.
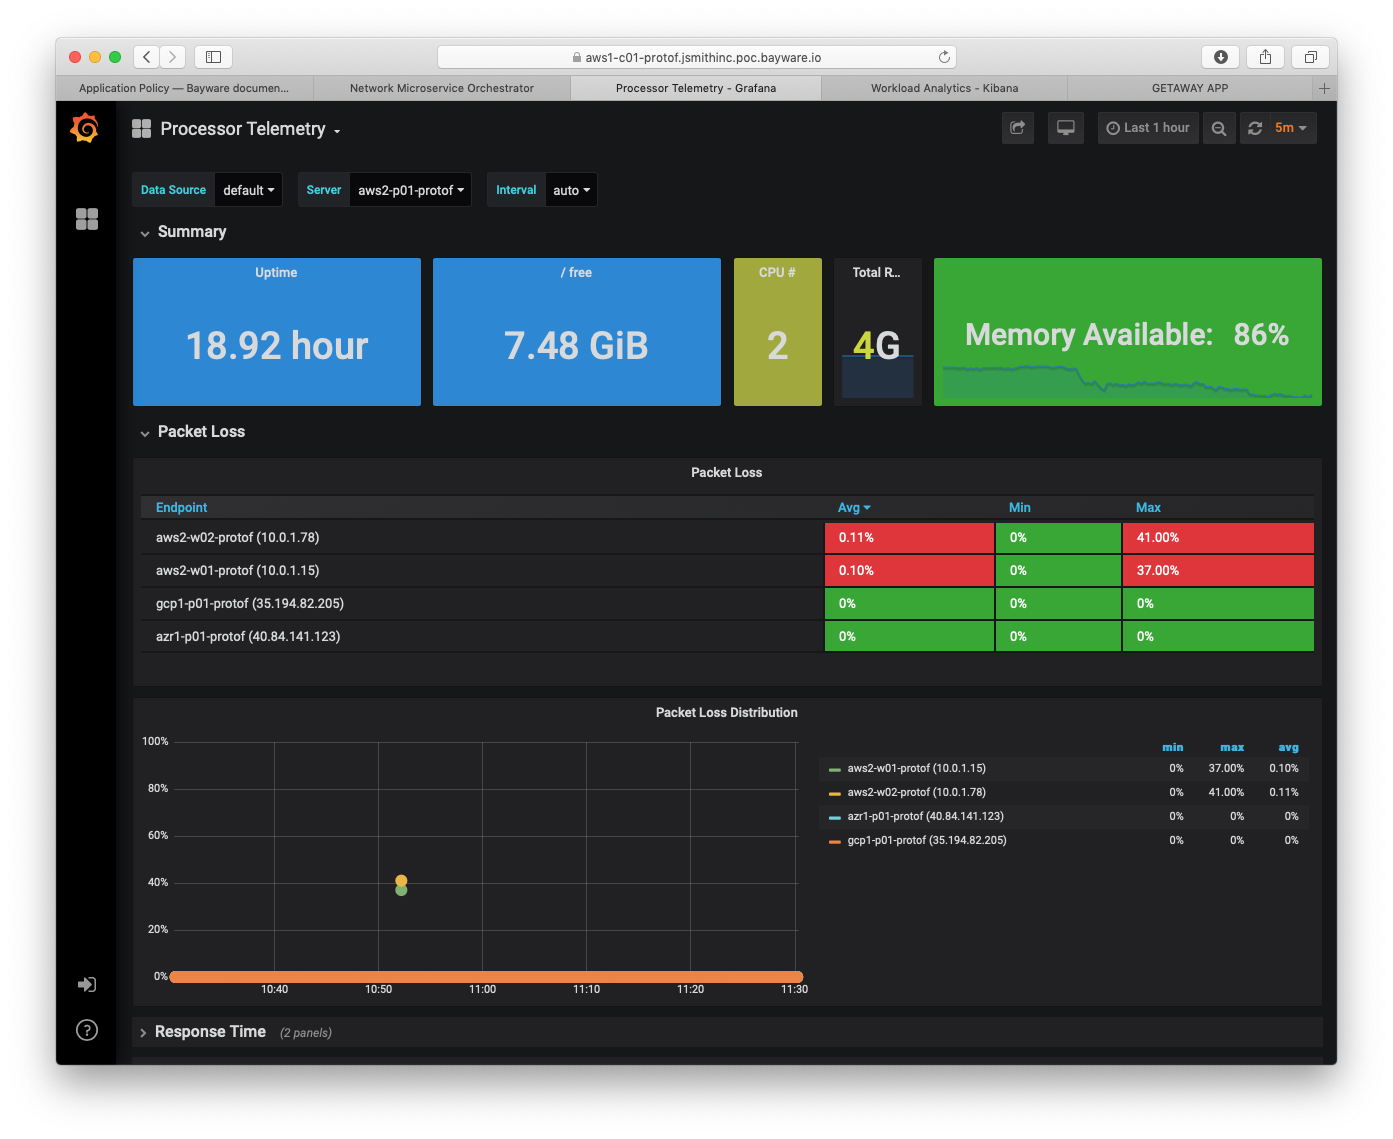
Fig. 97 Processor Telemetry - Packet Loss
Fig. 97 shows packet-loss statistics for server
aws2-p01-protof. (Recall that one uses the Server drop-down
menu in the upper part of the window to select the current server.) It shows
brief packet loss within the aws2 VPC itself, but no packet loss between
this server (running in aws2) and the ones running in gcp1 and
azr1.
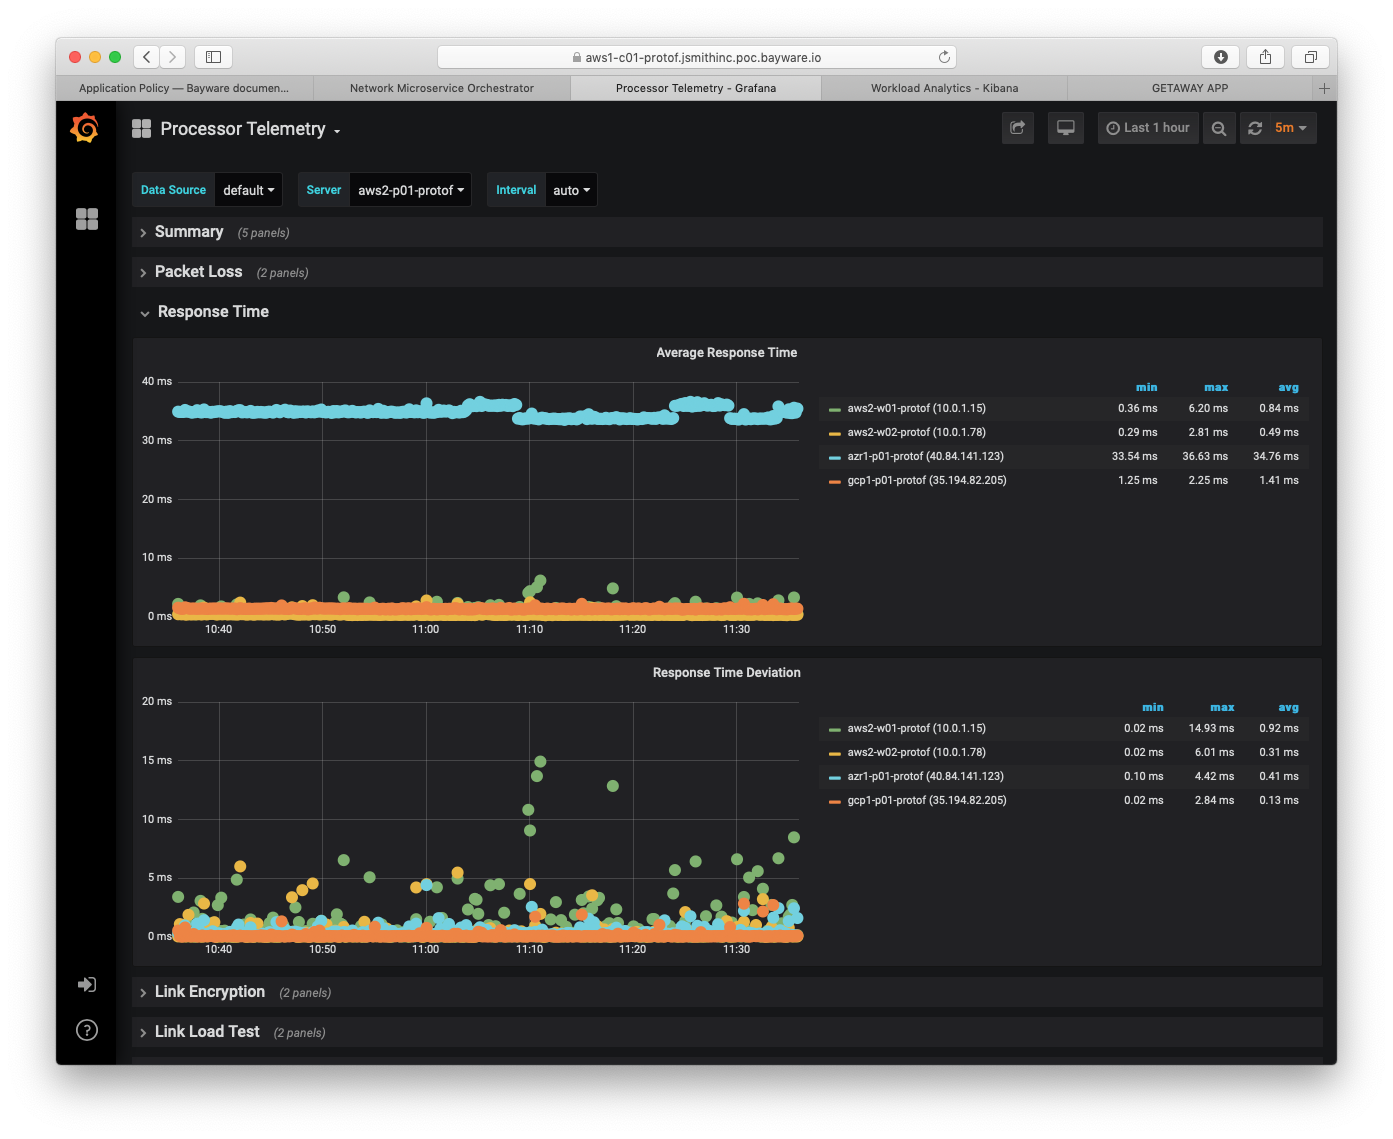
Fig. 98 Processor Telemetry - Response Time
Fig. 98 shows average response time and response time deviation between
aws2-p01-protof and each workload in aws2 as well as between this processor
and the processors in each of the other two cloud provider VPCs.
On the right, note that average response time within aws2 and with gcp1
is very low. All are < 1.5ms. Response time to Azure is a bit higher at
34.76ms, although, still quite acceptable.
Further, response time deviation values are low enough that this configuration could be used to carry real-time traffic.
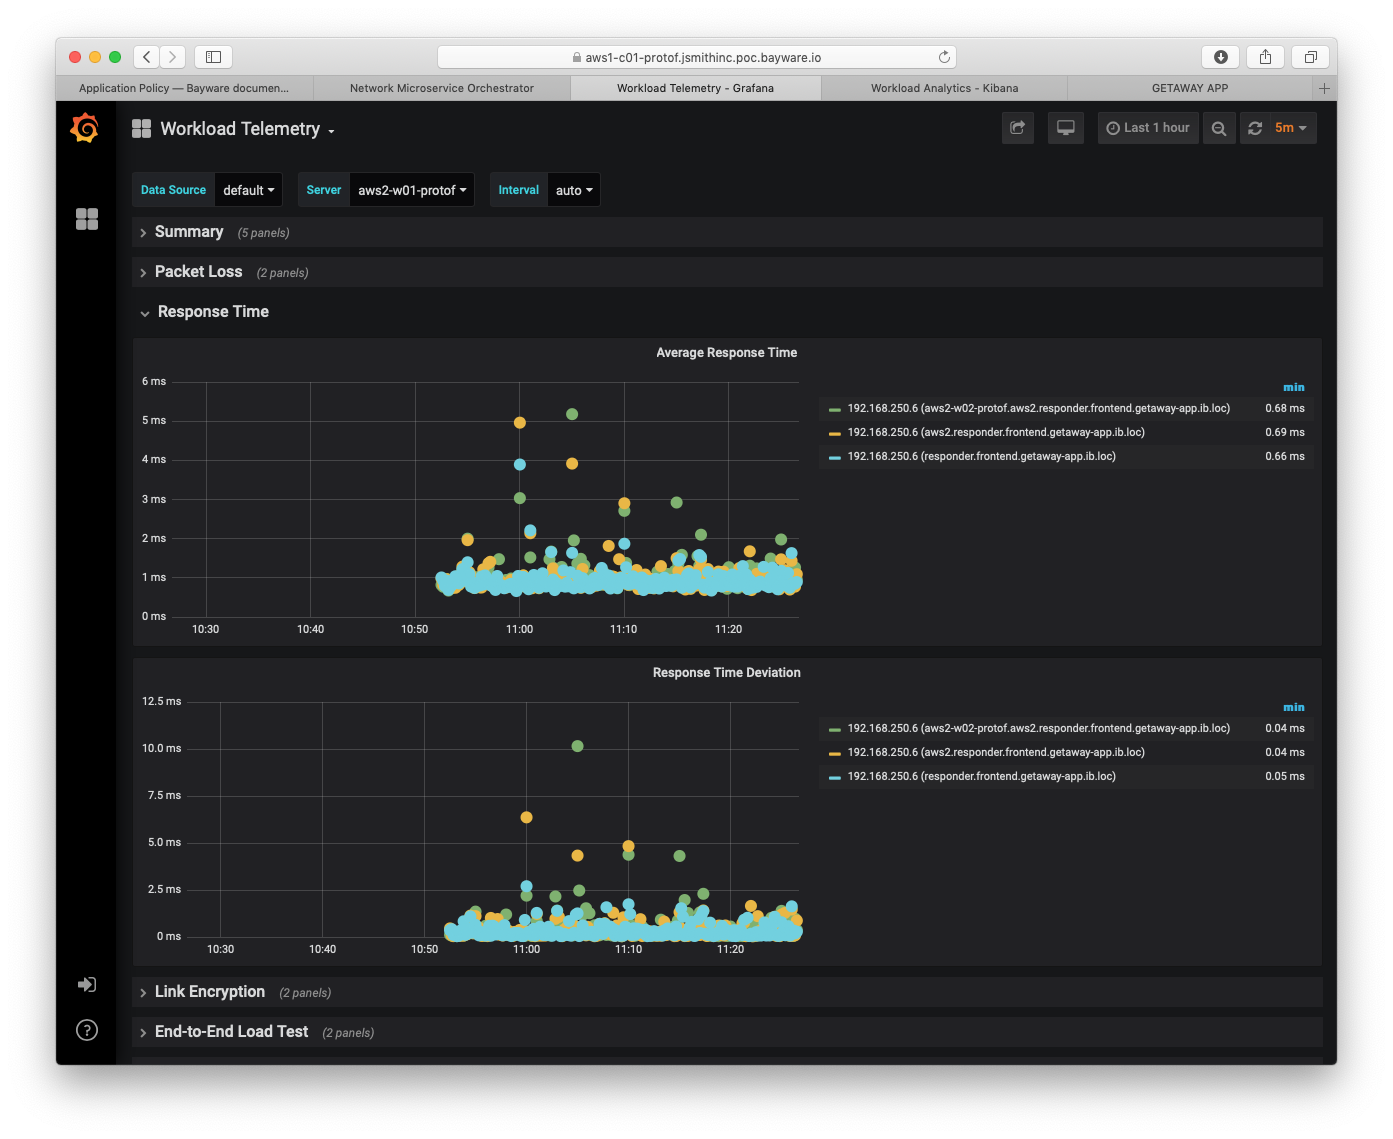
Fig. 99 Workload Telemetry - Response Time
Fig. 99 shifts to the Workload Telemetry dashboard
showing server aws2-w01-protof. This server runs the getaway-proxy
microservice and shows packet loss statistics with getaway-service,
which runs on aws2-w02-protof. Statistics measured are end-to-end i.e.,
from application microservice to application microservice.
Having end-to-end statistics between microservices becomes even more powerful
if you consider Fig. 100 below. Average response time and response
time deviation are shown between getaway-proxy microservice and
getaway-service microservice. Both are operating in aws2 VPC at
less than 1ms delay: this delay includes transiting through the policy engine
(aws2-p01-protof) as well as encryption/decryption and the policy agent.
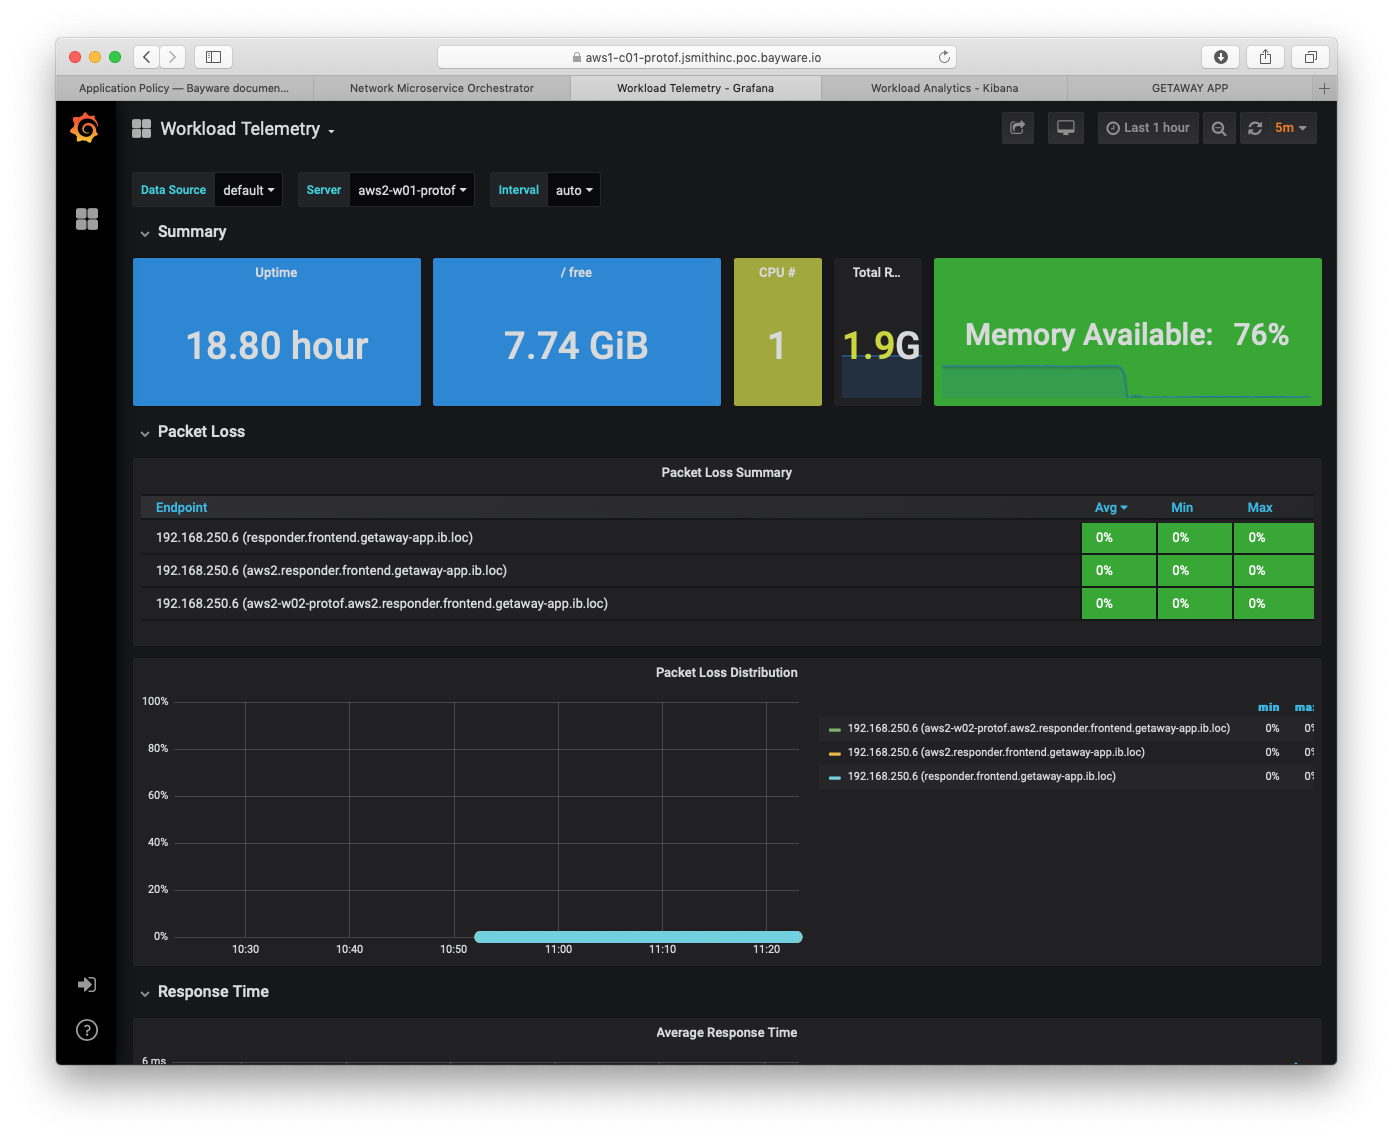
Fig. 100 Workload Telemetry - Packet Loss
Finally, Fig. 101 shows the Flow Telemetry dashboard.
The sFlow agent drop-down menu is set to azr1-p01-protof, which
serves the azr1 VPC with three microservices.
The main panel lists all SIF flows that leave and enter this VPC. The three microservices that communicate with getaway-service are getaway-news, getaway-places, and getaway-weather. Each direction appears in the panel.
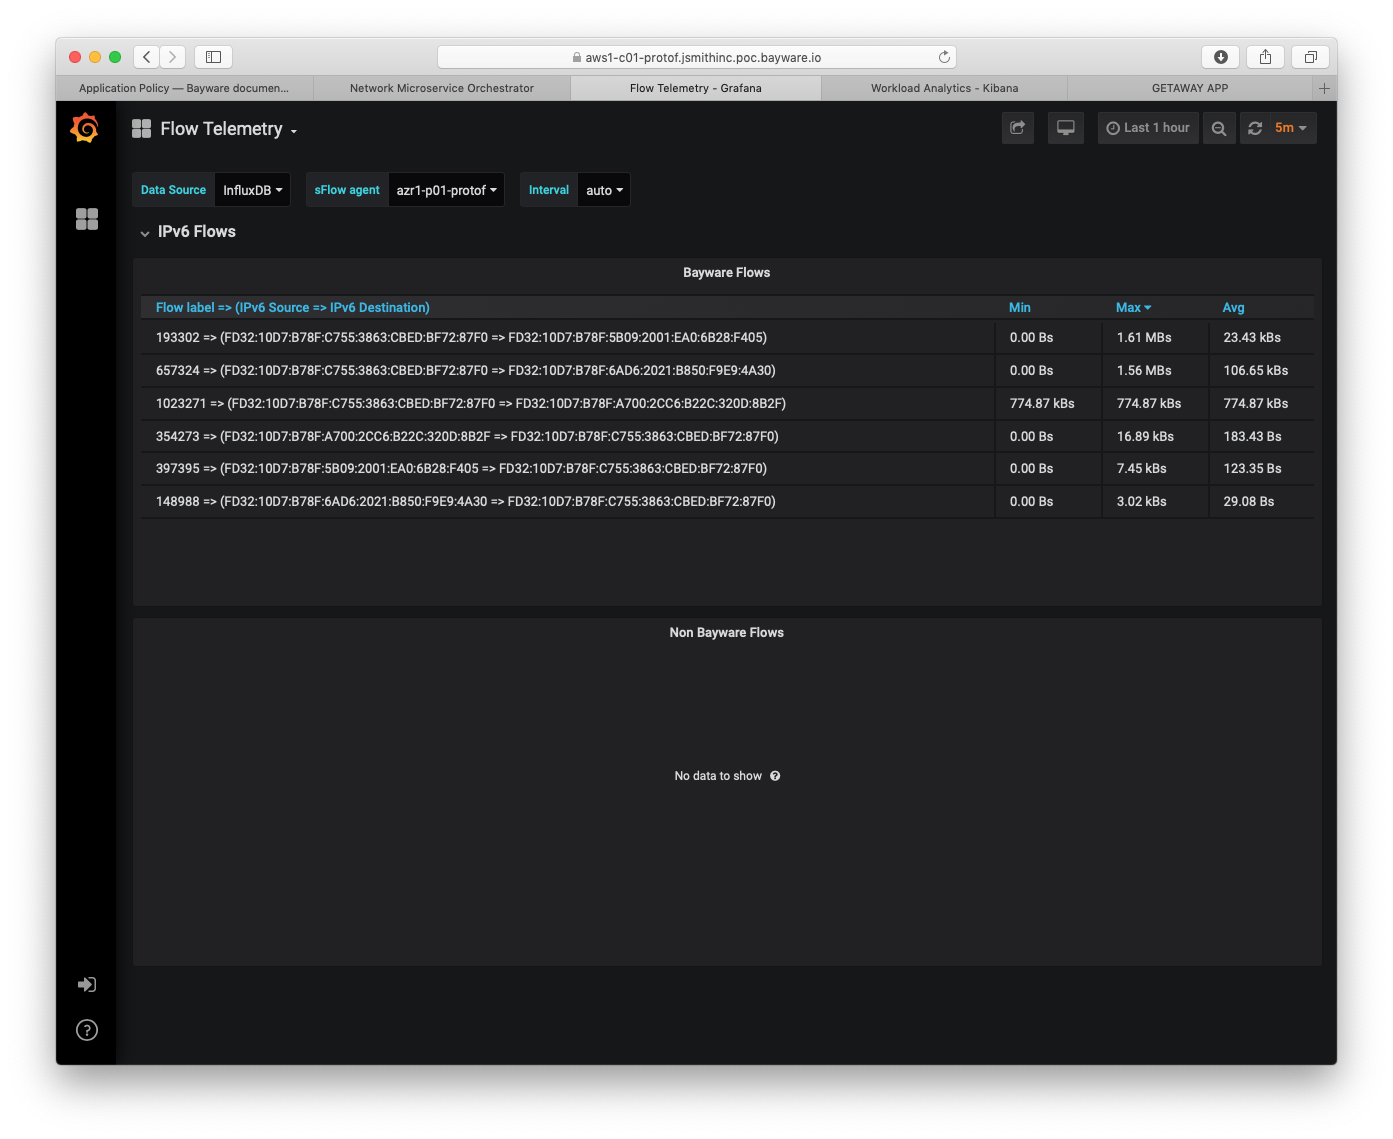
Fig. 101 Flow Telemetry
Summary
This section demonstarted how to use the Telemetry tools from the policy orchestrator. Statistics were shown for orchestrator, processor, and workload nodes as well as end-to-end telemetry for each flow from client to server.
Next up: now that you have completed the Deploying a Geo-Redundant App tutorial, contact Bayware (contact@bayware.io) if you would like to see how a Service Interconnection Fabric can simplify policy setup when deploying your own application.